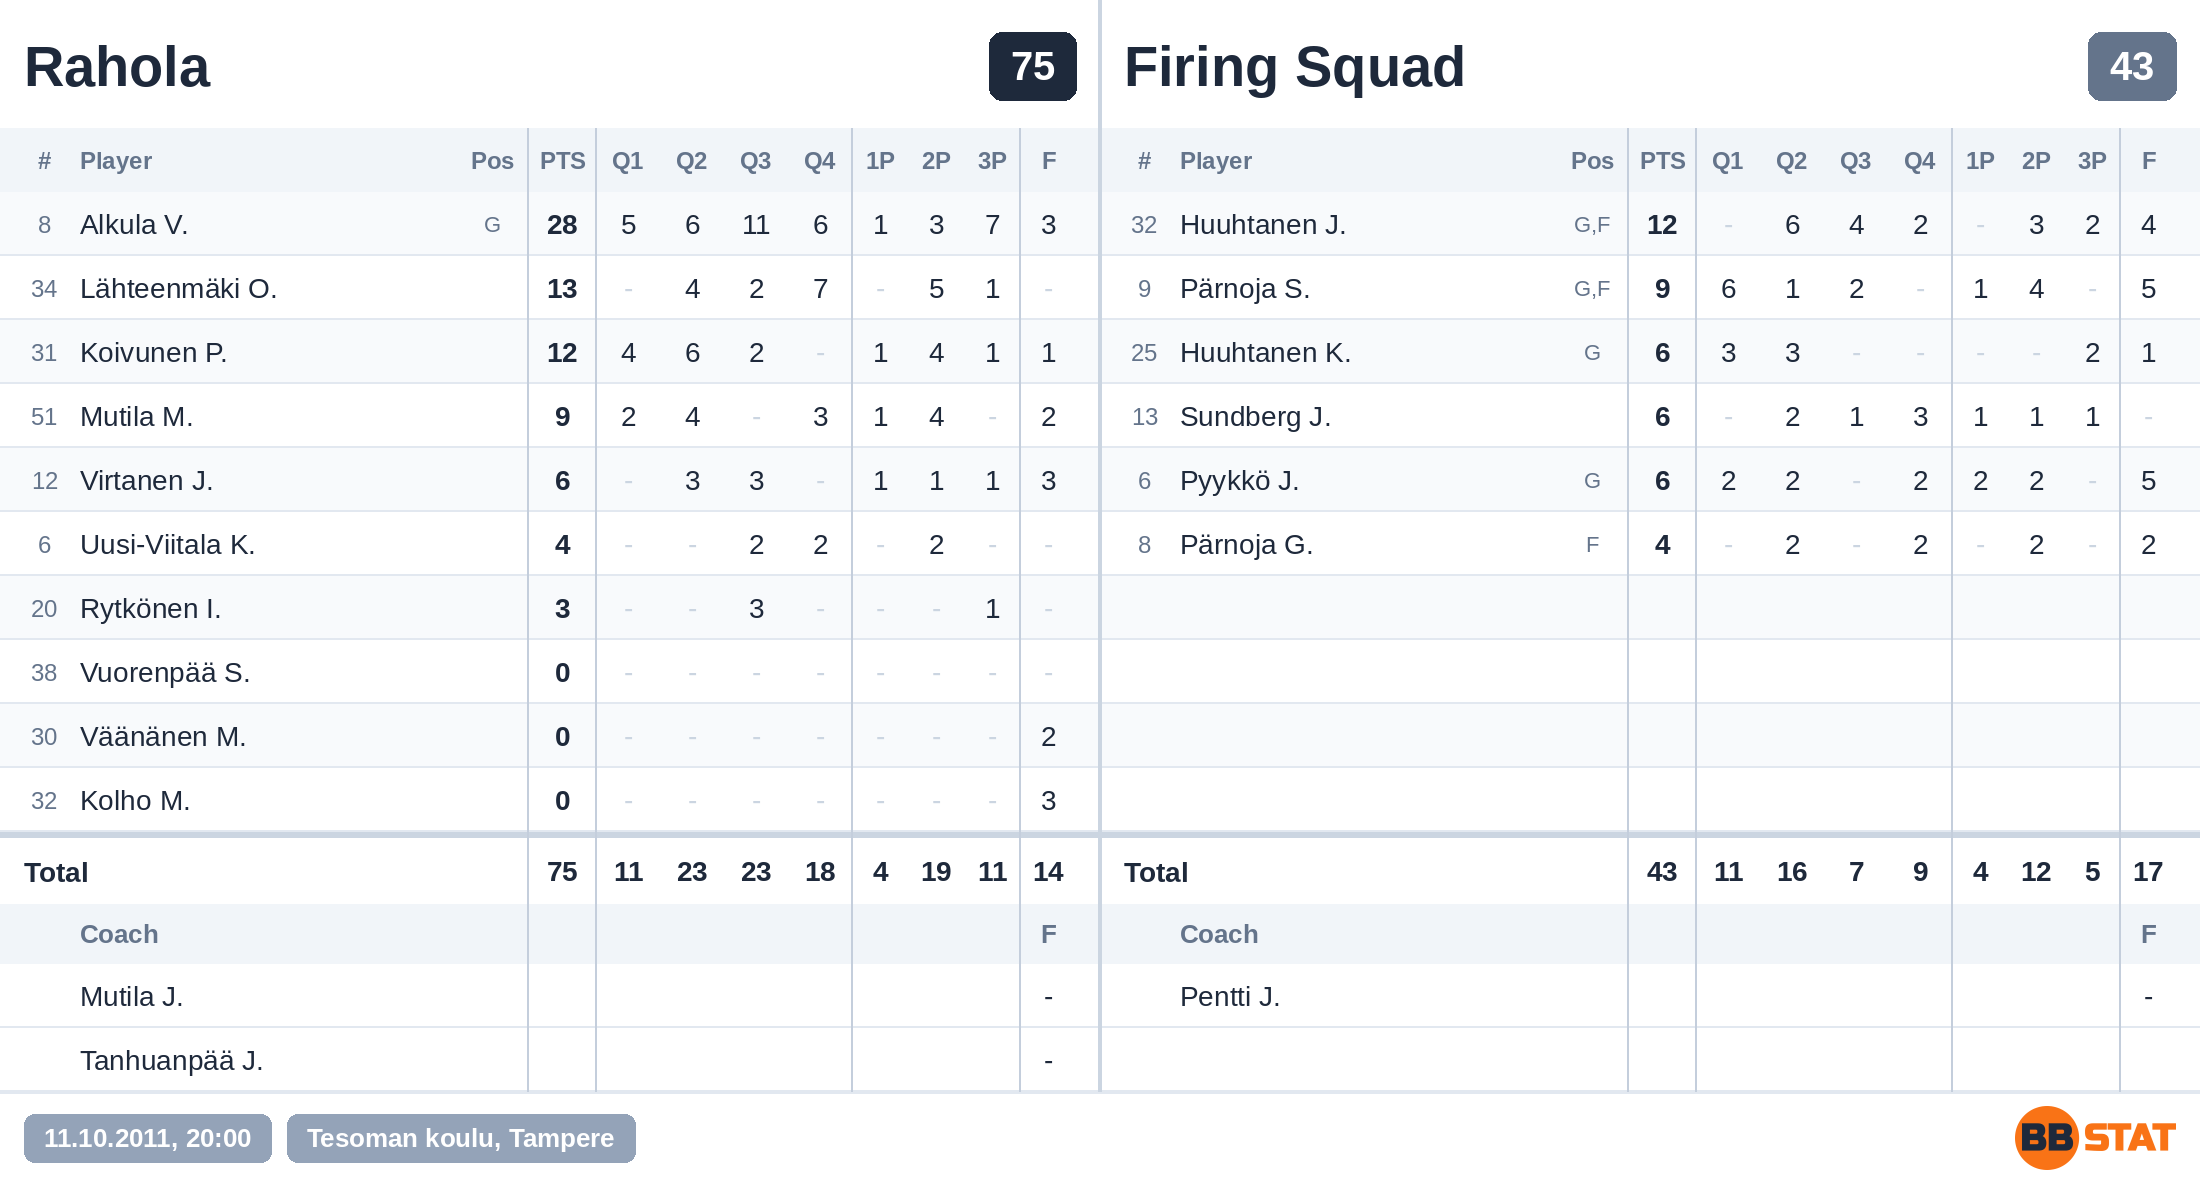
Rahola
Raholan Pyrkivä
75
:
43
Q1: 11-11
Q2: 23-16
Q3: 23-7
Q4: 18-9
Tue 11.10.2011
20:00

Firing Squad
BC Nokia
Tesoman koulu, Tampere
Spectators: 7
| Points in quarter | Baskets | Scoring by | Players | Fouls | |||||||||
|---|---|---|---|---|---|---|---|---|---|---|---|---|---|
| Teams | PTS Total points scored | Q1 | Q2 | Q3 | Q4 | 1P Free throws made (1-point baskets) | 2P 2-point field goals made | 3P 3-point field goals made | SP Points as starter | BP Points from bench | SPc Players scoring at least 1 point | S10Pc Players scoring at least 10 points | F Fouls |
| Rahola | 75 | 11 | 23 | 23 | 18 |
4
/ 12 33% |
19 | 11 |
55 73%
|
20 27%
|
7 / 10 | 3 / 10 | 17 |
| Firing Squad | 43 | 11 | 16 | 7 | 9 |
4
/ 4 100% |
12 | 5 |
37 86%
|
6 14%
|
6 / 6 | 1 / 6 | 17 |
| Difference | +32 | 0 | +7 | +16 | +9 | 0 | +7 | +6 | +18 | +14 | +1 | +2 | 0 |
Rahola
Winner| # Jersey number | Player | PTS Total points scored | Q1 | Q2 | Q3 | Q4 | 1P Free throws made (1-point baskets) | 2P 2-point field goals made | 3P 3-point field goals made | F Fouls | |
|---|---|---|---|---|---|---|---|---|---|---|---|
| 8 | Alkula, V. ● | 28 | 5 | 6 | 11 | 6 | 1 | 3 | 7 | 3 | |
| 34 | Lähteenmäki, O. | 13 | – | 4 | 2 | 7 | – | 5 | 1 | – | |
| 31 | Koivunen, P. ● | 12 | 4 | 6 | 2 | – | 1 | 4 | 1 | 1 | |
| 51 | Mutila, M. ● | 9 | 2 | 4 | – | 3 | 1 | 4 | – | 2 | |
| 12 | Virtanen, J. ● | 6 | – | 3 | 3 | – | 1 | 1 | 1 | 3 | |
| 6 | Uusi-Viitala, K. | 4 | – | – | 2 | 2 | – | 2 | – | – | |
| 20 | Rytkönen, I. | 3 | – | – | 3 | – | – | – | 1 | – | |
| 38 | Vuorenpää, S. ● | 0 | – | – | – | – | – | – | – | – | |
| 30 | Väänänen, M. | 0 | – | – | – | – | – | – | – | 2 | |
| 32 | Kolho, M. | 0 | – | – | – | – | – | – | – | 3 | |
| Total | 75 | 11 | 23 | 23 | 18 | 4 | 19 | 11 | 14 | ||
CoachMutila, J.
CoachTanhuanpää, J.
Top performers
Maximum points in game
28
Alkula, V.
Maximum 1P baskets made
1
Alkula, V.; Koivunen, P.; Mutila, M.; Virtanen, J.
Maximum 2P baskets made
5
Lähteenmäki, O.
Maximum 3P baskets made
7
Alkula, V.
Firing Squad
| # Jersey number | Player | PTS Total points scored | Q1 | Q2 | Q3 | Q4 | 1P Free throws made (1-point baskets) | 2P 2-point field goals made | 3P 3-point field goals made | F Fouls | |
|---|---|---|---|---|---|---|---|---|---|---|---|
| 32 | Huuhtanen, J. ● | 12 | – | 6 | 4 | 2 | – | 3 | 2 | 4 | |
| 9 | Pärnoja, S. ● | 9 | 6 | 1 | 2 | – | 1 | 4 | – | 5 | |
| 6 | Pyykkö, J. ● | 6 | 2 | 2 | – | 2 | 2 | 2 | – | 5 | |
| 13 | Sundberg, J. ● | 6 | – | 2 | 1 | 3 | 1 | 1 | 1 | – | |
| 25 | Huuhtanen, K. | 6 | 3 | 3 | – | – | – | – | 2 | 1 | |
| 8 | Pärnoja, G. ● | 4 | – | 2 | – | 2 | – | 2 | – | 2 | |
| Total | 43 | 11 | 16 | 7 | 9 | 4 | 12 | 5 | 17 | ||
CoachPentti, J.
Top performers
Maximum points in game
12
Huuhtanen, J.
Maximum 1P baskets made
2
Pyykkö, J.
Maximum 2P baskets made
4
Pärnoja, S.
Maximum 3P baskets made
2
Huuhtanen, J.; Huuhtanen, K.
The game in short
How is this calculated?Odds before the game: Rahola 98% – 2% Firing Squad
- Rahola was the favourite (98%) and won.
Why it went that way
- Threes: Rahola 11 (usual 7), Firing Squad 5 (usual 8): 21 points of margin for Rahola.
- Twos: Rahola 19 (usual 20.1), Firing Squad 12 (usual 18.8): 11.4 points of margin for Rahola.
Rahola · winner
Firing Squad · loser
Win probability:
Rahola
Firing Squad