Hand of Morbid
Morbid Basket
63
:
60
Q1: 15-16
Q2: 20-12
Q3: 15-13
Q4: 13-19
Wed 28.03.2012
20:15

Roosters
BC Nokia
Hervannan Ammattikoulu, Tampere
Spectators: 3
| Points in quarter | Baskets | Players | Fouls | ||||||||
|---|---|---|---|---|---|---|---|---|---|---|---|
| Teams | PTS Total points scored | Q1 | Q2 | Q3 | Q4 | 1P Free throws made (1-point baskets) | 2P 2-point field goals made | 3P 3-point field goals made | SPc Players scoring at least 1 point | S10Pc Players scoring at least 10 points | F Fouls |
| Hand of Morbid | 63 | 15 | 20 | 15 | 13 |
13
/ 24 54% |
22 | 2 | 10 / 12 | 3 / 12 | 18 |
| Roosters | 60 | 16 | 12 | 13 | 19 |
12
/ 28 43% |
15 | 6 | 7 / 8 | 2 / 8 | 18 |
| Difference | +3 | -1 | +8 | +2 | -6 | +1 | +7 | -4 | +3 | +1 | 0 |
Hand of Morbid
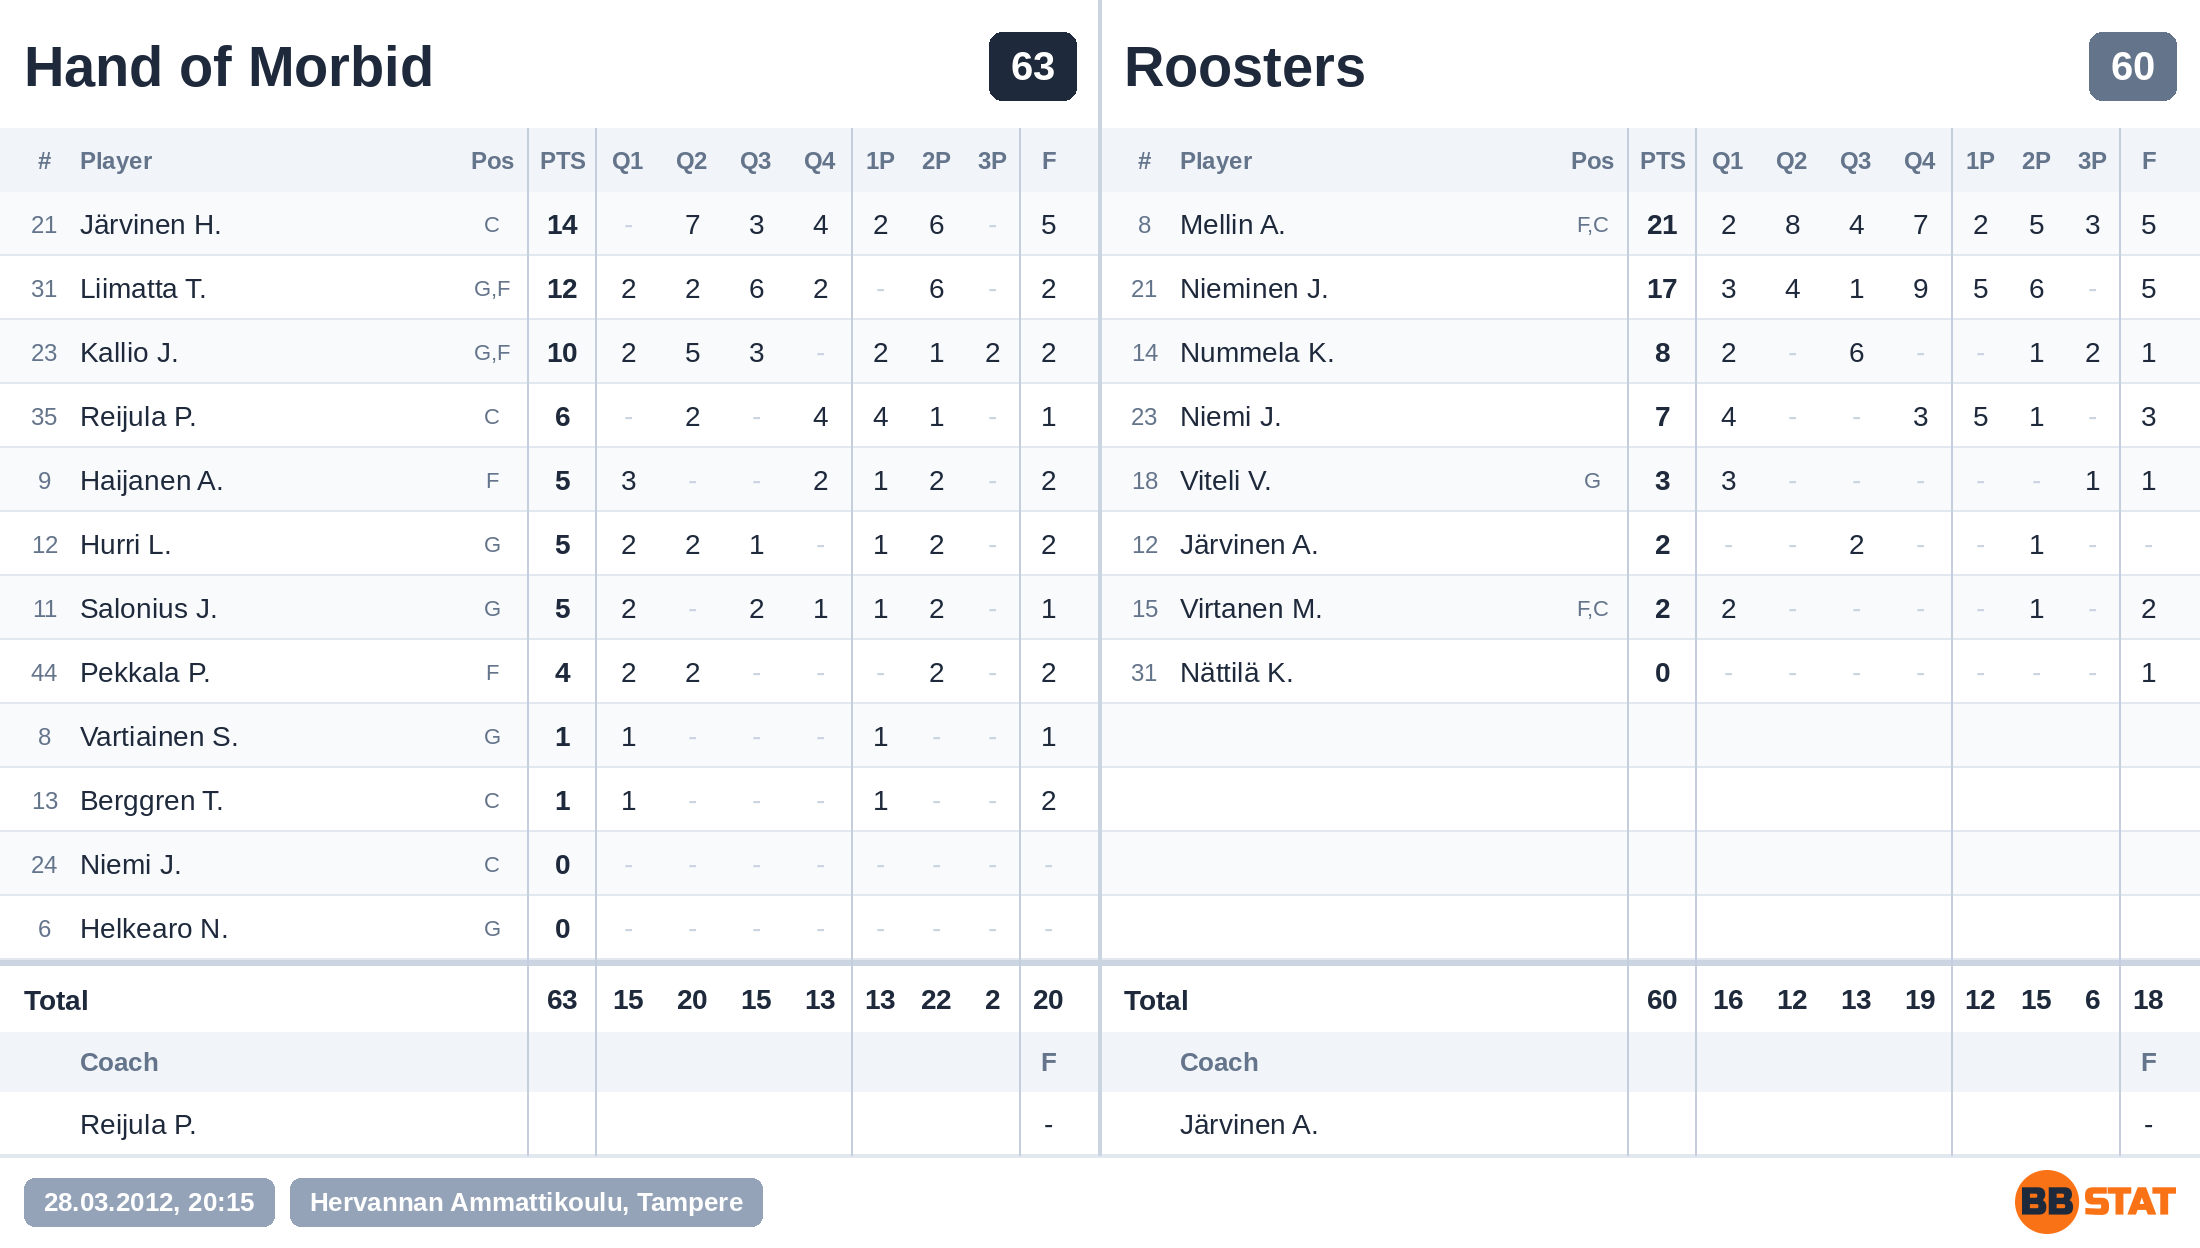
Winner| # Jersey number | Player | PTS Total points scored | Q1 | Q2 | Q3 | Q4 | 1P Free throws made (1-point baskets) | 2P 2-point field goals made | 3P 3-point field goals made | F Fouls | |
|---|---|---|---|---|---|---|---|---|---|---|---|
| 21 | Järvinen, H. | 14 | – | 7 | 3 | 4 | 2 | 6 | – | 5 | |
| 31 | Liimatta, T. ● | 12 | 2 | 2 | 6 | 2 | – | 6 | – | 2 | |
| 23 | Kallio, J. ● | 10 | 2 | 5 | 3 | – | 2 | 1 | 2 | 2 | |
| 35 | Reijula, P. ● | 6 | – | 2 | – | 4 | 4 | 1 | – | 1 | |
| 11 | Salonius, J. ● | 5 | 2 | – | 2 | 1 | 1 | 2 | – | 1 | |
| 9 | Haijanen, A. | 5 | 3 | – | – | 2 | 1 | 2 | – | 2 | |
| 12 | Hurri, L. | 5 | 2 | 2 | 1 | – | 1 | 2 | – | 2 | |
| 44 | Pekkala, P. ● | 4 | 2 | 2 | – | – | – | 2 | – | 2 | |
| 8 | Vartiainen, S. | 1 | 1 | – | – | – | 1 | – | – | 1 | |
| 13 | Berggren, T. | 1 | 1 | – | – | – | 1 | – | – | 2 | |
| 6 | Helkearo, N. | 0 | – | – | – | – | – | – | – | – | |
| 24 | Niemi, J. | 0 | – | – | – | – | – | – | – | – | |
| Total | 63 | 15 | 20 | 15 | 13 | 13 | 22 | 2 | 20 | ||
CoachReijula, P.
Top performers
Maximum points in game
14
Järvinen, H.
Maximum 1P baskets made
4
Reijula, P.
Maximum 2P baskets made
6
Liimatta, T.; Järvinen, H.
Maximum 3P baskets made
2
Kallio, J.
Roosters
| # Jersey number | Player | PTS Total points scored | Q1 | Q2 | Q3 | Q4 | 1P Free throws made (1-point baskets) | 2P 2-point field goals made | 3P 3-point field goals made | F Fouls | |
|---|---|---|---|---|---|---|---|---|---|---|---|
| 8 | Mellin, A. | 21 | 2 | 8 | 4 | 7 | 2 | 5 | 3 | 5 | |
| 21 | Nieminen, J. | 17 | 3 | 4 | 1 | 9 | 5 | 6 | – | 5 | |
| 14 | Nummela, K. | 8 | 2 | – | 6 | – | – | 1 | 2 | 1 | |
| 23 | Niemi, J. | 7 | 4 | – | – | 3 | 5 | 1 | – | 3 | |
| 18 | Viteli, V. ● | 3 | 3 | – | – | – | – | – | 1 | 1 | |
| 12 | Järvinen, A. ● | 2 | – | – | 2 | – | – | 1 | – | – | |
| 15 | Virtanen, M. ● | 2 | 2 | – | – | – | – | 1 | – | 2 | |
| 31 | Nättilä, K. | 0 | – | – | – | – | – | – | – | 1 | |
| Total | 60 | 16 | 12 | 13 | 19 | 12 | 15 | 6 | 18 | ||
CoachJärvinen, A.
Top performers
Maximum points in game
21
Mellin, A.
Maximum 1P baskets made
5
Nieminen, J.; Niemi, J.
Maximum 2P baskets made
6
Nieminen, J.
Maximum 3P baskets made
3
Mellin, A.
The game in short
How is this calculated?Odds before the game: Hand of Morbid 83% – 17% Roosters
- Hand of Morbid was the favourite (83%) and won.
Why it went that way
- Mellin A. (Roosters): Points 21 (usual 10.2).
- Threes: Hand of Morbid 2 (usual 5.1), Roosters 6 (usual 6.7): 7.2 points of margin for Roosters.
Hand of Morbid · winner
Roosters · loser
Win probability:
Hand of Morbid
Roosters