Lost Boys
Tampereen NMKY
66
:
78
Q1: 13-14
Q2: 16-15
Q3: 15-20
Q4: 22-29
Sat 11.10.2025
18:15

Pirkkalan Viri
Pirkkalan Viri
Namikan sali, Tampere
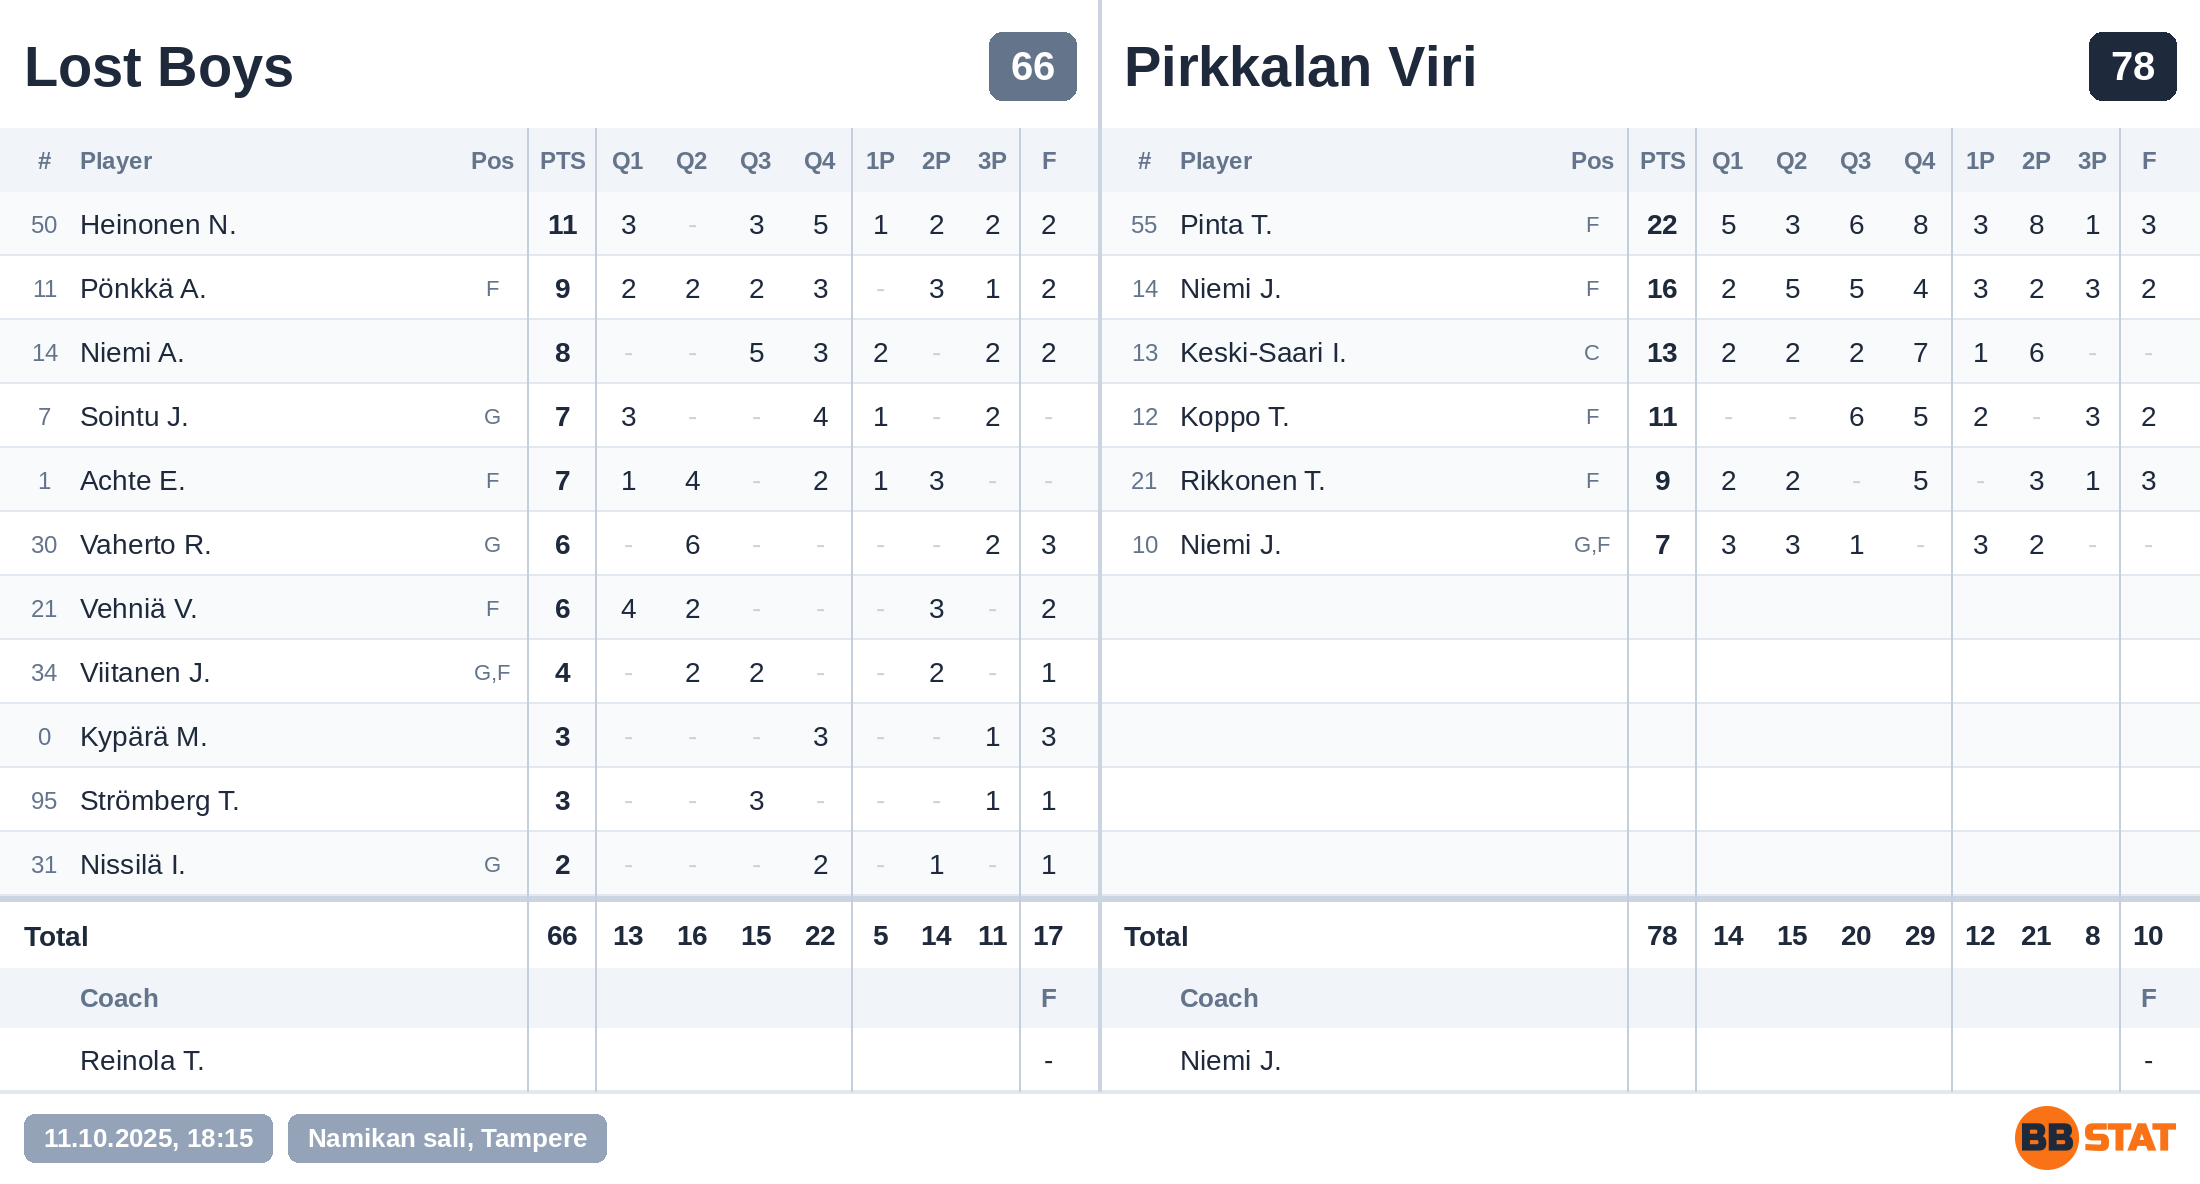
| Points in quarter | Baskets | Scoring by | Players | Fouls | |||||||||
|---|---|---|---|---|---|---|---|---|---|---|---|---|---|
| Teams | PTS Total points scored | Q1 | Q2 | Q3 | Q4 | 1P Free throws made (1-point baskets) | 2P 2-point field goals made | 3P 3-point field goals made | SP Points as starter | BP Points from bench | SPc Players scoring at least 1 point | S10Pc Players scoring at least 10 points | F Fouls |
| Lost Boys | 66 | 13 | 16 | 15 | 22 |
5
/ 10 50% |
14 | 11 |
33 50%
|
33 50%
|
11 / 11 | 1 / 11 | 17 |
| Pirkkalan Viri | 78 | 14 | 15 | 20 | 29 |
12
/ 25 48% |
21 | 8 |
69 88%
|
9 12%
|
6 / 6 | 4 / 6 | 10 |
| Difference | -12 | -1 | +1 | -5 | -7 | -7 | -7 | +3 | -36 | +24 | +5 | -3 | +7 |
Lost Boys
| # Jersey number | Player | PTS Total points scored | Q1 | Q2 | Q3 | Q4 | 1P Free throws made (1-point baskets) | 2P 2-point field goals made | 3P 3-point field goals made | F Fouls | |
|---|---|---|---|---|---|---|---|---|---|---|---|
| 50 | Heinonen, N. ● | 11 | 3 | – | 3 | 5 | 1 | 2 | 2 | 2 | |
| 11 | Pönkkä, A. | 9 | 2 | 2 | 2 | 3 | – | 3 | 1 | 2 | |
| 14 | Niemi, A. | 8 | – | – | 5 | 3 | 2 | – | 2 | 2 | |
| 1 | Achte, E. ● | 7 | 1 | 4 | – | 2 | 1 | 3 | – | – | |
| 7 | Sointu, J. ● | 7 | 3 | – | – | 4 | 1 | – | 2 | – | |
| 21 | Vehniä, V. ● | 6 | 4 | 2 | – | – | – | 3 | – | 2 | |
| 30 | Vaherto, R. | 6 | – | 6 | – | – | – | – | 2 | 3 | |
| 34 | Viitanen, J. | 4 | – | 2 | 2 | – | – | 2 | – | 1 | |
| 0 | Kypärä, M. | 3 | – | – | – | 3 | – | – | 1 | 3 | |
| 95 | Strömberg, T. | 3 | – | – | 3 | – | – | – | 1 | 1 | |
| 31 | Nissilä, I. ● | 2 | – | – | – | 2 | – | 1 | – | 1 | |
| Total | 66 | 13 | 16 | 15 | 22 | 5 | 14 | 11 | 17 | ||
CoachReinola, T.
Top performers
Maximum points in game
11
Heinonen, N.
Maximum 1P baskets made
2
Niemi, A.
Maximum 2P baskets made
3
Achte, E.; Vehniä, V.; Pönkkä, A.
Maximum 3P baskets made
2
Heinonen, N.; Sointu, J.; Niemi, A.; Vaherto, R.
Pirkkalan Viri
Winner| # Jersey number | Player | PTS Total points scored | Q1 | Q2 | Q3 | Q4 | 1P Free throws made (1-point baskets) | 2P 2-point field goals made | 3P 3-point field goals made | F Fouls | |
|---|---|---|---|---|---|---|---|---|---|---|---|
| 55 | Pinta, T. ● | 22 | 5 | 3 | 6 | 8 | 3 | 8 | 1 | 3 | |
| 14 | Niemi, J. ● | 16 | 2 | 5 | 5 | 4 | 3 | 2 | 3 | 2 | |
| 13 | Keski-Saari, I. ● | 13 | 2 | 2 | 2 | 7 | 1 | 6 | – | – | |
| 12 | Koppo, T. ● | 11 | – | – | 6 | 5 | 2 | – | 3 | 2 | |
| 21 | Rikkonen, T. | 9 | 2 | 2 | – | 5 | – | 3 | 1 | 3 | |
| 10 | Niemi, J. ● | 7 | 3 | 3 | 1 | – | 3 | 2 | – | – | |
| Total | 78 | 14 | 15 | 20 | 29 | 12 | 21 | 8 | 10 | ||
CoachNiemi, J.
Top performers
Maximum points in game
22
Pinta, T.
Maximum 1P baskets made
3
Pinta, T.; Niemi, J.; Niemi, J.
Maximum 2P baskets made
8
Pinta, T.
Maximum 3P baskets made
3
Niemi, J.; Koppo, T.
The game in short
How is this calculated?Odds before the game: Lost Boys 71% – 29% Pirkkalan Viri
- Pirkkalan Viri won although Lost Boys had a 71% chance to win before the game, based on rosters and recent form.
Why it went that way
- Twos: Pirkkalan Viri 21 (usual 21.1), Lost Boys 14 (usual 22.7): 17.2 points of margin for Pirkkalan Viri.
- Threes: Pirkkalan Viri 8 (usual 9.7), Lost Boys 11 (usual 7.9): 14.4 points of margin for Lost Boys.
Lost Boys · loser
Pirkkalan Viri · winner
Win probability:
Lost Boys
Pirkkalan Viri