Predictions are here: win probabilities and season projections
Every game page and every league now has predictions. They are estimates calculated from past results, and the new page How the predictions work explains them in detail.
Win probability
Before a game bbSTAT looks at how each team has done in its last eight games, the recent scoring of the players who are likely to play, and in some leagues home court. From these it works out the chance that each team wins. During the game the same calculation is repeated with the real score and the time left, so the win probability line on the game page moves as the game goes on.
Season projections
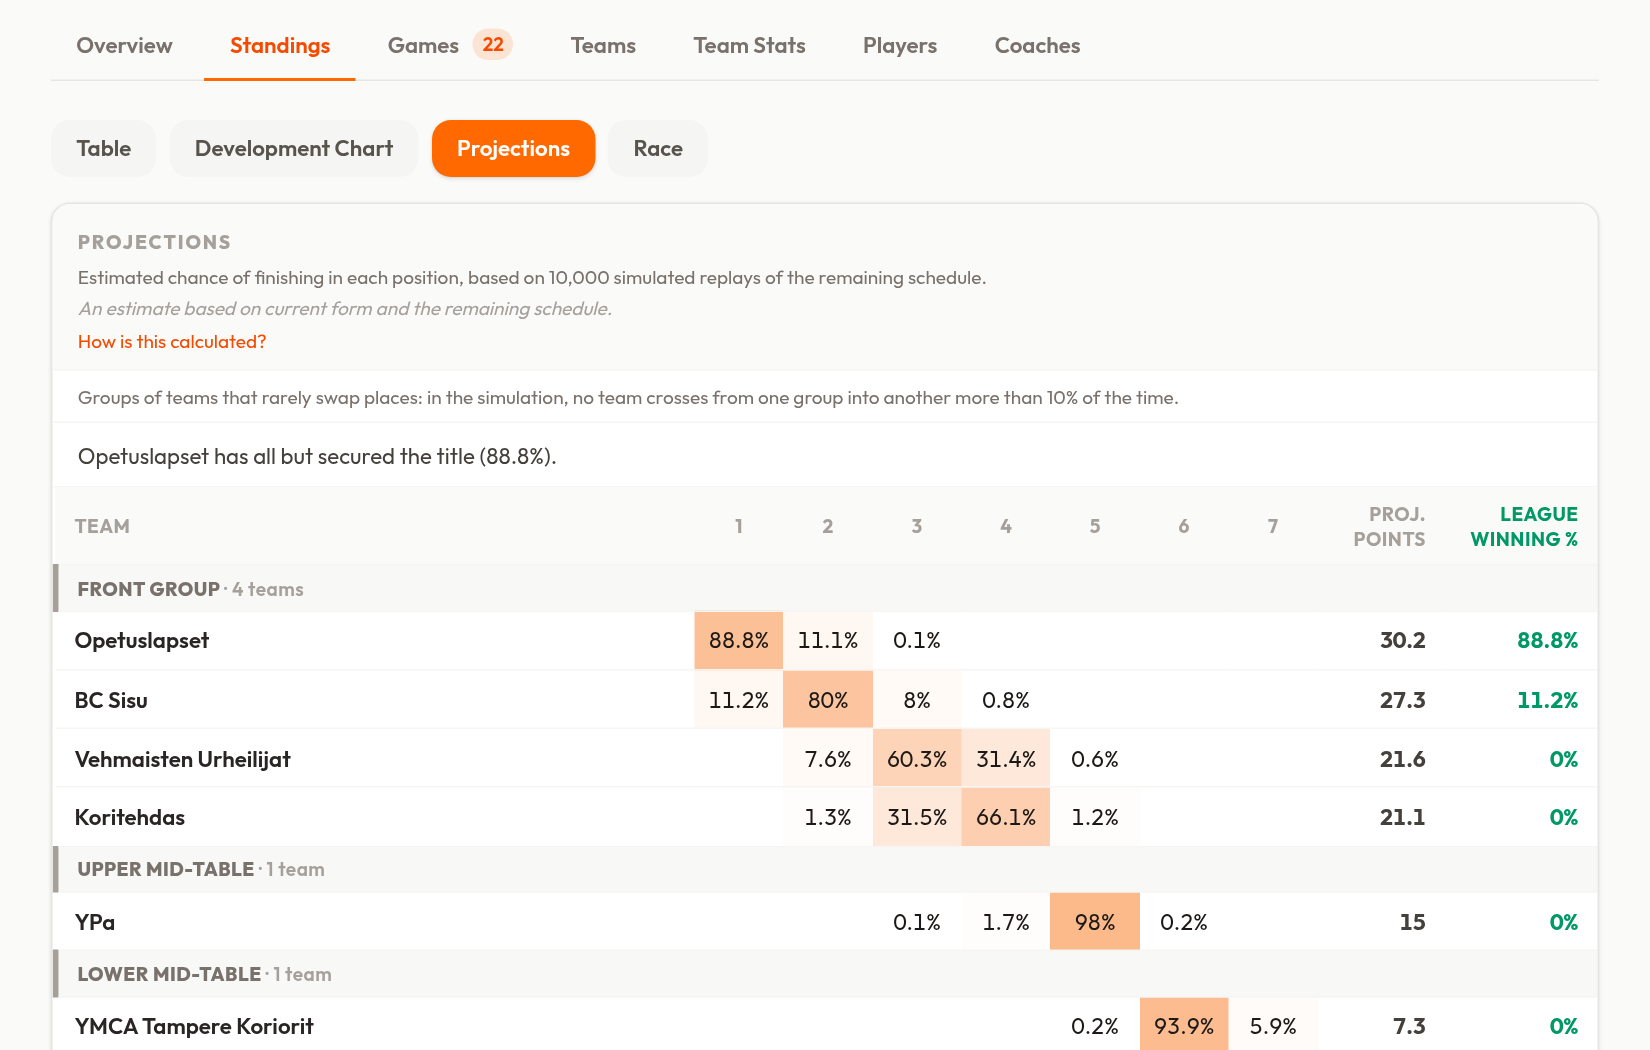
A league table only shows what has happened. To estimate how the season will end, bbSTAT plays the remaining games on a computer thousands of times and counts where each team finishes. The Projections tab of a league shows the result: a darker cell means a more likely final position, and the chart of title chances shows how the picture has changed during the season.
Want to see how one game unfolded? Read Game flow and win probability.
How good are they?
We tested the projections on past seasons by pretending the season was, for example, 60% played. The projected probabilities came out clearly closer to the real final tables than assuming that today’s table stays as it is. The page also lists what the model does not know: injuries, playoffs, and anything the bookkeeper does not record. A 10% chance still happens about once in ten times.